Barn Swallow: A Report
Purpose of this writing
We have heard that Barn Swallows are on the list of Species at Risk. In many areas they are still quite common, and it is often difficult to recognize that their population is in decline. I wrote this essay to explain why they are listed as “threatened” and to inform interested non-researchers about their declining population.
– Sumiko Onishi, Field Supervisor/Bander in Charge
The Population Trend – Let’s watch the Barn Swallow!
In April of each year migratory swallows start showing up on Pelee Island and we feel the change of seasons as soon as we see them. Barn Swallows, and their closely related cousins, Purple Martins are lined up on hydro lines beside the roadside making lively chattering noises whenever we see them. They are like familiar neighbors that have come back from their annual trip.
Barn Swallows (Hirundo rustica) are common swallow species seen the world over. They live on every continent except Antarctica. Because the population is widespread, they are listed as a ‘least concern’ species which does not require special protection by the International Union for Conservation of Nature and Natural Resources.
A nature essay written in the 1980s in my home country of Japan described how Hirundo rustica used to nest under the eaves and the walls of every house in the early 1900s. Some of the house owners built ramps under their nests to support their fledglings which also help avoiding the birds’ feces landing on the floor. The owners often created openings to allow the swallows to enter and exit the house. With the advent of modern agriculture in the 1950s, farmlands were sprayed with pesticides where hundreds of Barn Swallows flying all around to feed on the disturbed insects. The author points out that far fewer swallows have been seen after those changes in agriculture took place. Since the early 2000s some districts in Japan have started listing Hirundo rustica as a species at risk. Of course, there are other reasons for population decline, such as habitat loss. European scientists have pointed out that Hirundo rustica’s population has declined by almost fifty percent since 1975. It is also clear that their population has been significantly affected by changing land use patterns.
On Pelee Island we see large groups of Barn Swallows after their arrival roosting in the tall grasses around Lake Henry and Fox Pond during their breeding season. They are very busy collecting dry grasses and mud from the unpaved roads and ditches to build their nests and raise their fledglings. They build many of their homes around our houses and we are entertained by them throughout the summer. It is sometimes hard to imagine that their population is actually declining.
In Canada the population decline has been observed since the mid-1980s. The Breeding Bird Survey conducted by Environment and Climate Change Canada’s Canadian Wildlife Service, showed a population decline of 3.6% per year, which translates into a total population decrease of 76% for the past 40 years. As a result of these findings, Barn Swallows were listed in 2011 as ‘Threatened’ by the Committee on the Status of Endangered Wildlife in Canada (COSEWIC), which serves as an independent advisor to the Minister of Environment and Climate Change Canada. Based on 30% decline of the population in the last ten years of this study the Ontario government has become concerned that they are very likely to become endangered. The Ontario Species at Risk Act in 2012 listed the Barn Swallow as “threatened”.
Recently we received an organized summary of some of the data we collected for the years 2003 to 2016 which were produced by the Canadian Migration Monitoring Network (CMMN). According to the summary, our annual survey indicates that the spring Barn Swallow population on Pelee Island has declined by 4.11% a year for the 14 years. This decline in our data is still not as significant as that seen in other CMMN stations in Ontario and Quebec.
In Canada, Bird Canada, (former Bird Study Canada) has made a serious effort to grapple with this decline. They are experimenting with special nest boxes for the species to learn about behavior and habitat. This population decline is getting attention all over the world. Behavior like breeding near a manmade environment, and the pattern of gathering closely together for nesting might have a big effect on their population trend. Studies in Europe (Denmark) published in 2001 observed that clutch sizes are affected by the availability of their food, which mainly consists of insects associated with cattle. Decreasing of the number of young successfully fledged results in smaller populations returning to the area over the years.
We are interested in seeing the long-term trends of the Barn Swallow population at our station, and if our results are different from those of other CMMN stations. Also, we hope our unique location will provide a happy home for the breeding and roosting population, and they will flourish on Pelee Island.
To those who are more interested in other species population trends please visit Bird Canada’s NatureCounts website. Thank you for CMMN to provide those data for us.
Sources
NatureCounts, Birds Canada
https://www.birdscanada.org/birdmon/default/main.jsp
Liam Casey, “Inside Ontario’s fight to save declining barn swallows, one bird house at a time”, The Canadian Press 2017
Inside Ontario’s fight to save declining barn swallows, one bird house at a time
Species at Risk, Government of Canada
https://www.canada.ca/en/environment-climate-change/services/species-risk-public-registry/cosewic-assessments-status-reports/barn-swallow-2011.html#_cas
Muku Hatojyu, Historia Naturalis (1984)
Peter, D. Moore, Dairy declines hard to swallow, Nature (21 June 2001)
https://www.nature.com/articles/35082185
Møller, A. P. J. Appl. Ecol. 38, 378–389 (2001)
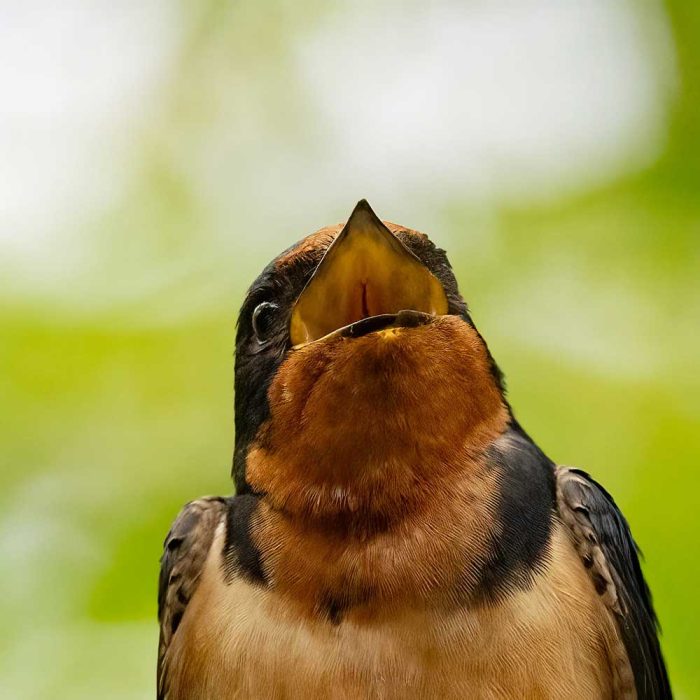
Photos of Barn Swallows by Sumiko Onishi
Key to the output files
• Trend file:
o “Trnd” is the estimate of % change per year over the period analyzed.
o “post_prob” indicates the posterior probability that the direction of the trend (positive or negative) is correct. This number can be used as a pseudo p-value, such that trends with a posterior probability > 0.9 can be considered to have strong support.
o “lower_ci” and “upper_ci” (lower and upper credible interval) define the range of values within which the true trend or annual index falls with a probability of 95%.
o “analysis_code” indicates the temporal pattern of presence for each species at each site. Table 1 (below) explains what each code represents and how the trend is most appropriately interpreted.
• Index file:
“Index” is the annual index: calculated in logged form as part of generating the trend as a % per year change, then back-transformed to a more understandable estimate of average birds per day.
• Index Plots:
Trend information above each graph shows the long-term trend (% per year change), lower and upper CI, and posterior probability, as defined above. Also shown (in parentheses following species name and season) is the analysis code that indicates what trend represents (See Table 1).
Table 1. Key to Analysis Codes and interpretation of trends
M = regular migrant, 75+% of season covered by station in 2/3 or more of all years. Analysis window limited to migratory surge, and few individuals are present before or after. Species is well-monitored at the site. Trends are of good quality and represent change in population size for a large area of the station’s catchment area.
ML = Similar to M, except that numbers before/after migratory peak (i.e. local area birds) amount to more than a quarter of peak numbers during the migratory surge. Although the analysis window is limited to the period of migratory surge, the resulting trend can be strongly affected by local population level (which may or may not agree with trend for birds migrating through the site). Note that “local area” birds are those regularly observed at a station, though they may not breed or winter at the site itself.
I = Irruptive and irregular migrants: species without a regular pattern of migratory movement. Analysis window
covers the period in which there is at least occasional movement, but much of movement may fall outside of station coverage. Annual indices represent annual variation in extent and timing of irruption. Over the long term, population trends may be discernible despite the high degree of annual variation, but should be interpreted case by case.
L = Birds from local area (not necessarily breeding or wintering at count site per se, but regularly observed there), lacking seasonal patterns suggestive of through movement. Trends are assumed to reflect population change in the local area, which may or may not agree with trends at broader geographic scales.
S = Staging species (usually waterfowl and shorebirds) with pattern of migratory surge of which 75% or more of the movement period is covered by the station. Some ‘S’ species could be changed to ‘M’ if there is evidence that their movements are unidirectional and there is minimal stopover. In most cases, however, trends may represent site use rather than population change, as there may be annual variation in use of the specialized stopover sites in the region, only one of which is being monitored. Trends should be interpreted case by case.
MX = Regular migrant, but coverage at site falls short of documenting 75% of migration period. Shifts in timing of migration are not detectable from the data (e.g. change in timing due to climate change could produce a trend that is independent of true population size.) This is a subclass of “O” species, but is designated separately to draw attention to species that could become ‘M’ with more extended coverage.
O = Other, for species that do not fit into any of the above groups. Individuals may represent one or a combination of categories: casual visitation, premigratory dispersal, departing winter populations, or others. Trends very unlikely to represent population change either at a broad scale or in a definable local population.


